
Right now, the single most common thing South Africans ask an AI for is help with homework.
Not code. Not business plans. Homework — 12.9% of everything South Africans bring to Claude, the biggest category we have. Our teenagers adopted this technology quietly, at their desks, well before most of our workplaces did.
So the question we get from parents is a fair one, and it usually arrives with real worry behind it: is the thing my child wants to study still going to be there when they finish?
The honest answer isn't the one you'll find in most headlines. It's better than that — and it's more useful.
What actually happens when you measure AI use
Anthropic, the company behind the Claude AI system, has been publishing something called the Economic Index: millions of real, anonymous AI conversations matched against the United States Department of Labor's catalogue of work — a list of 17,998 individual tasks that make up nearly 800 occupations. Not predictions. Not a survey of what executives think might happen. A record of what people actually used AI to do.
Here is the number that should reframe this whole conversation for you.
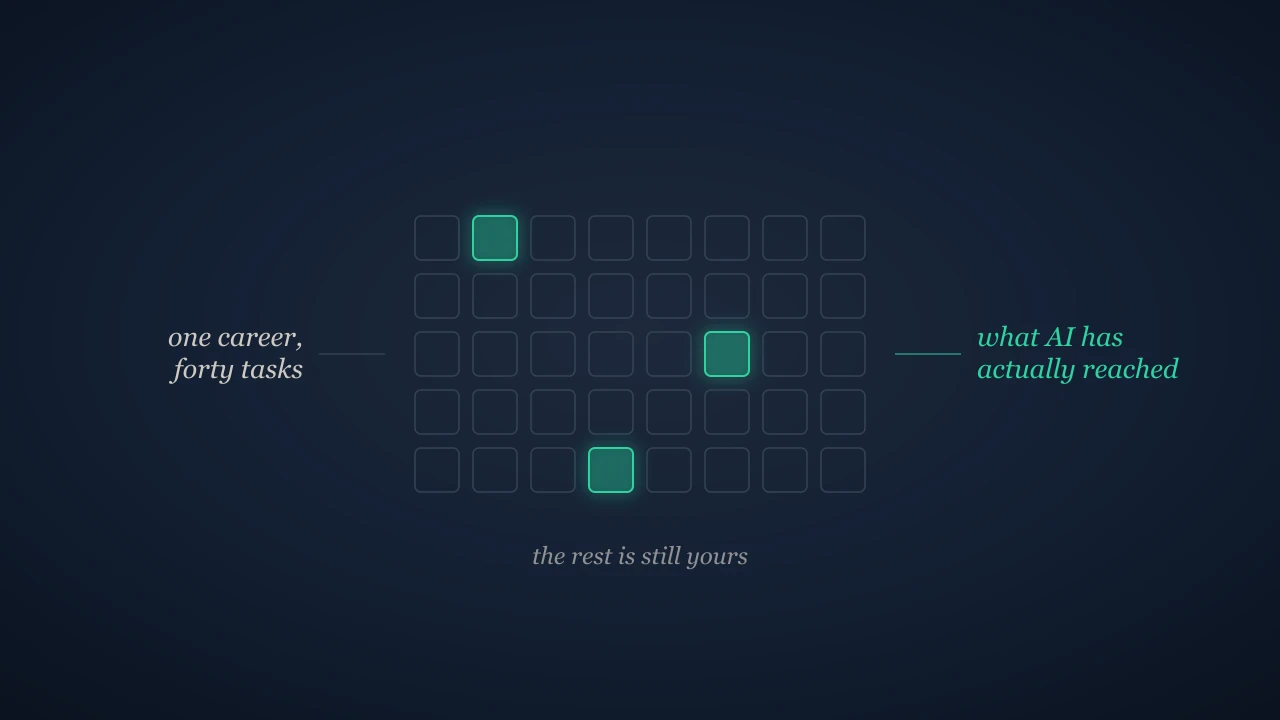
Of those 17,998 tasks, only 1,354 show any meaningful AI use at all. Fewer than one in thirteen. The other 92% of the catalogued work of the world — everything people are paid to do — is, so far, untouched.
That is not a picture of a workforce being replaced. It's a picture of a tool that is very good at a narrow, specific slice of what jobs are made of.
So which careers are safe?
Wrong question — and it's worth understanding exactly why, because the answer is the whole point.
AI doesn't consume careers. It consumes tasks. And no career is one task. Your child's future job is a bundle of thirty or forty different things: producing, deciding, persuading, checking, repairing, comforting, showing up. AI has reached into some of those and not others, and it does that unevenly inside every single occupation on the list.
Which means the question "is teaching safe?" or "is accounting safe?" can't be answered, because neither of those is a thing AI acts on. It acts on the pieces.
(A note on the numbers below: when we say AI is "involved in about a third" of a job, we mean roughly that share of the day-to-day tasks making up that occupation currently show real AI use. It doesn't mean a third of those workers have been replaced. It means a third of the work now has a tool in it — the way spreadsheets got involved in accounting without ending accountants.)
Two people in the same office, two very different answers
The clearest proof sits inside a single industry, and it's the finding that convinced us to write this.
Computer Programmer is the most AI-exposed occupation on the entire list. Roughly three-quarters of what that job involves day to day now shows real AI use. If any career were going to be "taken", it's this one.
Software Developer — same industry, same building, often the same product, frequently the same degree — sits at under a third.
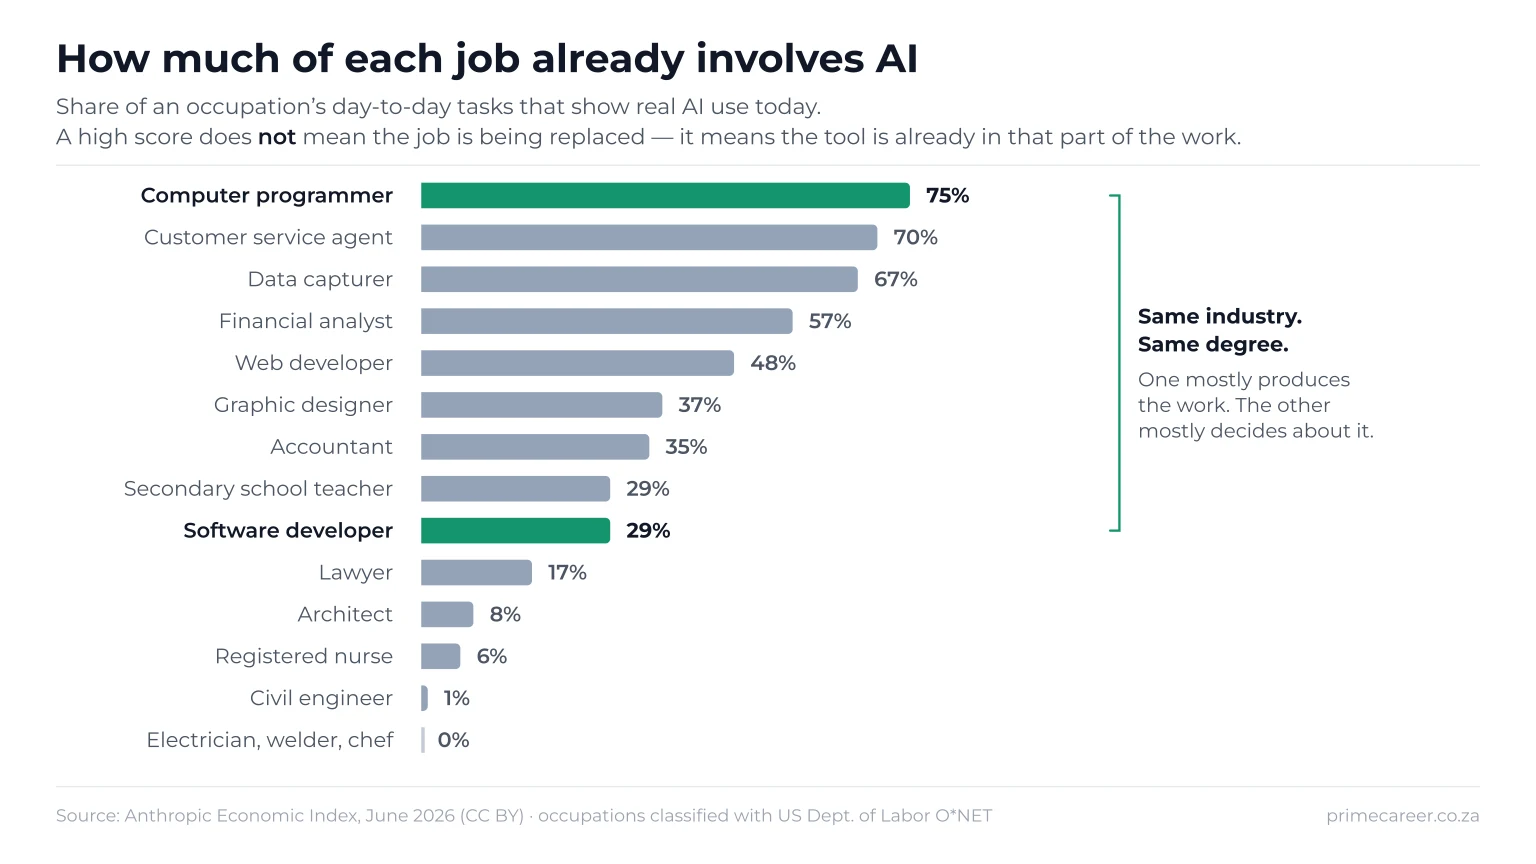
Why the enormous gap between two jobs that sound identical? Because one of them is mostly producing the code, and the other is mostly deciding what to build, why, for whom, and what happens when it breaks.
That distinction — between producing the thing and deciding about the thing — turns out to run through almost every occupation measured.
The same pattern, everywhere you look
Financial analysts sit high; accountants sit at about half their level. Graphic designers are meaningfully exposed; architects barely register. Registered nurses are near the bottom. Civil engineers are close to zero.
At the very top of the exposed list you find data capturers, medical records clerks and customer service agents — work that is mostly moving structured information from one place to another.
At the bottom: electricians, welders, carpenters, motor mechanics, chefs. Zero measurable AI use. Not low. None. Plumbers scrape in at 1%.
What survives, consistently, is work that requires judgement, physical presence, accountability for the outcome, or another human being in the room.
Does that mean the trades are guaranteed?
No — and we'd rather say so than sell you a comfortable line.
That measurement records what is being done through a screen, today. It says nothing about robotics, which is a completely separate question, and nothing about ten years from now. The same list also puts a few desk jobs at zero, which tells you the measure goes quiet at the bottom rather than issuing certificates of safety.
Treat it as evidence about the shape of work, not a prophecy about your child's life.
So what do we do with this as parents?
The instinct is to steer — to nudge a teenager toward whichever field looks most fortified. We'd ask you not to, for a reason that has nothing to do with technology.
Nobody can price the job market of 2040. But we can already see what happens when a young person picks a course for a defensive reason rather than a fitting one: they lose interest in second year, they disengage, and a large number of them leave. Up to 60% of South African first-year students don't reach second year, and the wrong-fit choice is one of the biggest drivers. A teenager who chose a field because it looked AI-proof, but who is miserable in it, is more fragile — not less. They will be outlasted by someone who actually wants to be there.
There's also a quieter finding worth knowing. In South Africa, AI use splits almost exactly in half between doing the task for someone and helping them do it themselves. Same tool, same subscription, two completely different outcomes for your child. The one who understands their own strengths knows which side of that line they're standing on. The one who doesn't, outsources the thinking and never finds out what they were good at.
Which brings it back to the only durable answer we know of:
Help your child find out what they're genuinely good at, and what kind of work they can sustain. Not the safest field. The one where their judgement is the thing being paid for — because judgement is the part AI has consistently failed to reach, in every occupation measured.
That was the right advice before any of this arrived. The data has simply made it urgent.
Figures in this article come from the Anthropic Economic Index (June 2026 release) and its labour market impacts research, published openly under a Creative Commons licence. Occupations are classified using the US Department of Labor's O*NET framework; South African job titles don't map onto it perfectly, so read the occupations as shapes of work rather than exact local equivalents.
Start the Conversation
Your teenager doesn't need to predict the future. They need to know what they're good at — and to be able to say it out loud.
The Prime Career Guide maps your child's personality against their interests across all four pathways — university, TVET, learnership and entrepreneurship — and shows you where their judgement is likely to be worth the most.